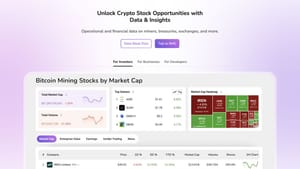
Bitcoin Mining Stocks Heatmap
The highlight for me this month is the Bitcoin Mining Stocks Heatmap, which can be accessed by clicking the squares icon above the table on the market cap page. The heatmap is a great way to visualize the ups and downs of the Bitcoin mining stock market at a glance, where darker shades of green or red indicate a larger percentage move in the positive or negative respectively. We've also included a new "dominance" variable, which shows you what percentage of the total market cap a particular stock accounts for. This is also represented visually by the size of a specific stock's tile.

We are currently working on a few visual improvements to the heatmap, as well as a dropdown menu which will allow you to swap the heatmap between the market cap and volume metrics. Tiles will also become clickable, taking you directly to a company's profile page.
Bitcoin Mining Stocks Enterprise Value
Enterprise Value (EV) is an important metric that measures a company’s total value by considering not only its market capitalization but also its debt and cash levels. EV can be thought of as the effective cost of buying a company or the theoretical price of a target company before factoring in a takeover premium. This offers a more comprehensive reflection of a company's true worth than market capitalization alone. Thus, we have added a dedicated page for metrics relating to EV.

You'll also find an EV/EH/s column on this page, representing Enterprise Value per Exahash per second. This metric helps investors assess how efficiently different companies are using their mining resources in relation to their overall valuation, providing valuable insights into which mining stocks might be undervalued or overvalued based on their hashing power.
Below the table, there's a chart section displaying all these metrics. The Enterprise Value vs. Market Cap chart offers a quick visual reference, making it easy to spot which companies have a higher enterprise value than their market cap, or vice versa.

Top Gainers and Losers for Bitcoin Mining Stocks
While technically you can view Bitcoin mining stock gainers and losers by sorting the change column on the market cap page, we felt it was important to create a dedicated page for this information to enhance its presentation. This page is divided into two sections, gainers and losers, displaying the daily percentage change and volume for each simultaneously.

In the future, once certain prerequisites are met, we'll enable users to adjust the timeframe for the percentage change, allowing you to track stock performance over different periods, such as 1M, 6M, 1Y, and YTD. We're also exploring the idea of setting up a bot that will automatically share the top-performing stocks at the close of particular trading periods, leveraging the data from this page.
Company Press Release Section
On company profiles, there is now a section which displays all the latest press releases for that company. Clicking a card will take you to the original release, so it can be read in full. Later I am interested in getting short summaries of all the key information from those releases, so users can get up to speed without having to read the full release which can sometimes be very long.

We are in the process of adding more sections for general company news as well as upcoming events. This will probably be added later this month.
Shares Column, BTC/EH/s, Anchor links
In addition to the more major features already covered, we've done lots of little improvements all throughout the site which you may have already noticed. Starting with the market cap page, we added a column for shares at the request of one of our users. This value for Shares Outstanding can sometimes change, and while it can be calculated by dividing the market cap by share price, we thought it was good to have a dedicated column to compare the amount of shares between Bitcoin mining companies.

On the Bitcoin Production page, we've added a column and chart for BTC/EH/s, which is the amount of Bitcoin a company produced for each EH/s of mining power they are operating. This is a good metric to see how efficient Bitcoin mining companies are, and if you look at the chart you will notice most of the companies have a quite similar result - which is to be expected. If a company has a greater number for BTC/EH/s, they must be doing something that is greatly improving their mining efficiency. The opposite can be said for those with a lower value in this field.

Finally, on pages that include charts, you will notice there is now a bar chart icon at the top right of the table. This is an anchor link which will take you to the section of the page where the chart is located. Otherwise, I we felt that some users may miss the chart completely if they did not scroll to the bottom.
That's all for this month. We'd love to hear from you if you have any suggestions or feedback about our website. You can use the contact page to get in touch with us or reach out on X. Please also consider subscribing to our newsletter and becoming a paid member to support our ongoing product development. I look forward to updating you all again next month!


