

Bitcoin mining saw a decline in production during 2024 compared to the previous year, primarily due to the Bitcoin halving event. Despite this reduction, improved market conditions allowed miners to benefit from higher Bitcoin prices, partially offsetting the impact of lower output.
Revenue Growth Across the Industry
As shown in the table below, all of the 15 largest miners (by market cap) experienced revenue growth during the first nine months of the year. In general, the companies with the highest revenue growth were those that significantly expanded their hash rate. However, there were notable exceptions, particularly Riot Platforms (RIOT), Bitfarms (BITF), and Bit Digital (BTBT).
Riot and Bitfarms achieved impressive hash rate growth of 117.76% and 109.43%, respectively, as of September 30, 2024. Yet, their revenue growth fell short of these figures due to rising operational costs and M&A activities, which constrained profitability.
On the other hand, Bit Digital's story diverged further. With only an 38.20% increase in hash rate by September 30, 2024, the company achieved an impressive 183.96% YoY revenue growth for the first nine months, making it the fastest-growing company in terms of revenue. The key driver of Bit Digital’s revenue growth was its HPC/AI hosting operations, which will be explored further in the chapter dedicated to HPC/AI.
Note: Data for IREN, Applied Digital, and Hive do not fully cover the first nine months of 2024 due to their home-country reporting formats. Foreign issuers listed on U.S. exchanges are not generally required to file quarterly reports.
Mixed Performance in Gross Margins
Beyond revenue growth, gross margin performance varied significantly among companies, reflecting differences in operational efficiency and cost management strategies.
Data sources: SEC filings and company presentations. Data for IREN, Applied Digital, and Hive do not fully cover the first nine months of 2024 due to their home-country reporting formats. Foreign issuers listed on U.S. exchanges are not generally required to file quarterly reports.
Mixed Performance in Gross Margins
Beyond revenue growth, gross margin performance varied significantly among companies, reflecting differences in operational efficiency and cost management strategies.
Calculations are based on data from SEC filings & company websites
Operational Efficiency Leaders: Companies like CleanSpark (CLSK), Hut 8 Corp (HUT), and Cipher Mining (CIFR) reported substantial improvements in gross margins. CleanSpark led the way, increasing its gross margin from 45.37% in 2023 to 62.59% in 2024. These improvements indicate enhanced cost management and a more favorable revenue environment.
Struggles with Cost Pressures: On the other end of the spectrum, several companies continued to face challenges. MARA Holdings (MARA) and Riot Platforms (RIOT) improved their gross margins compared to the prior year but still reported negative figures at -24.11% and -14.78%, respectively. Similarly, Bitfarms (BITF) and Canaan (CAN) struggled with negative gross margins, despite Canaan improving significantly to -43.18%.
Stable Performers: Companies like TeraWulf (WULF) and Bit Digital (BTBT) maintained relatively stable or slightly improving gross margins, reflecting consistent operational performance.
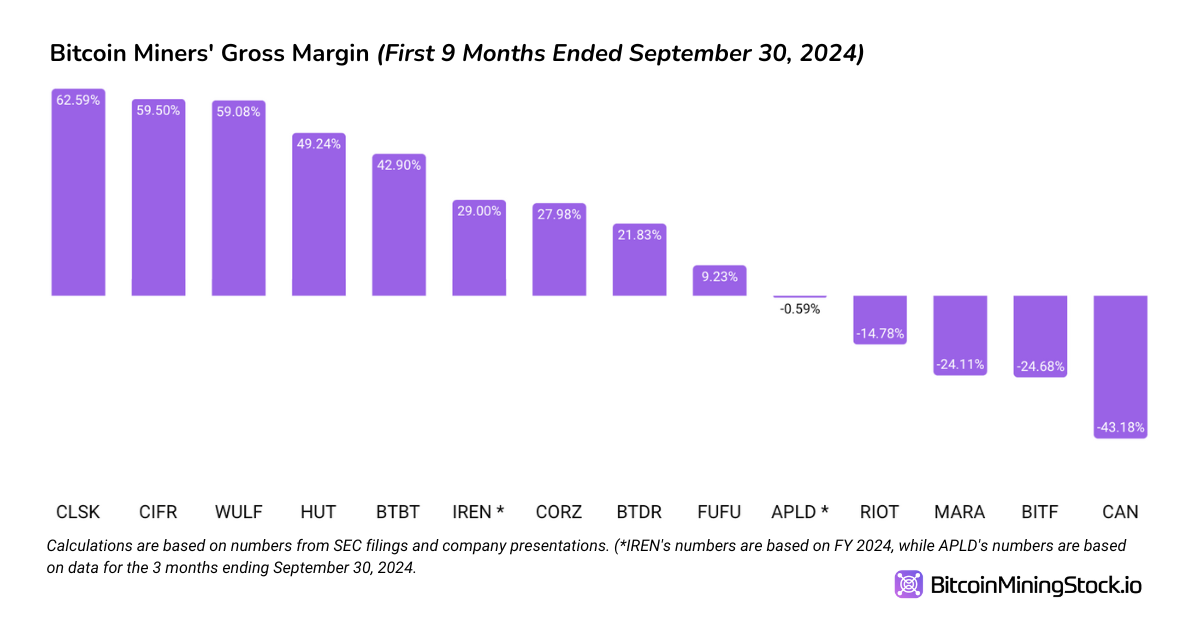
Overall, we see some miners have leveraged operational efficiencies and market opportunities to achieve robust margin growth, others continue to struggle with cost pressures and operational inefficiencies.
Looking ahead, the ability to balance expansion cost with profitability will be critical for miners aiming to remain competitive. Additionally, the embracing HPC and AI-related opportunities, as demonstrated by Bit Digital’s success, suggests that diversification may become an essential strategy for stable growth.
Enjoy the read? You can download a full copy of 2024 Bitcoin Mining Review from here.


